> ## Documentation Index
> Fetch the complete documentation index at: https://docs.avicenna.dev/llms.txt
> Use this file to discover all available pages before exploring further.
# Logs
> View and monitor all requests made to your API endpoints.
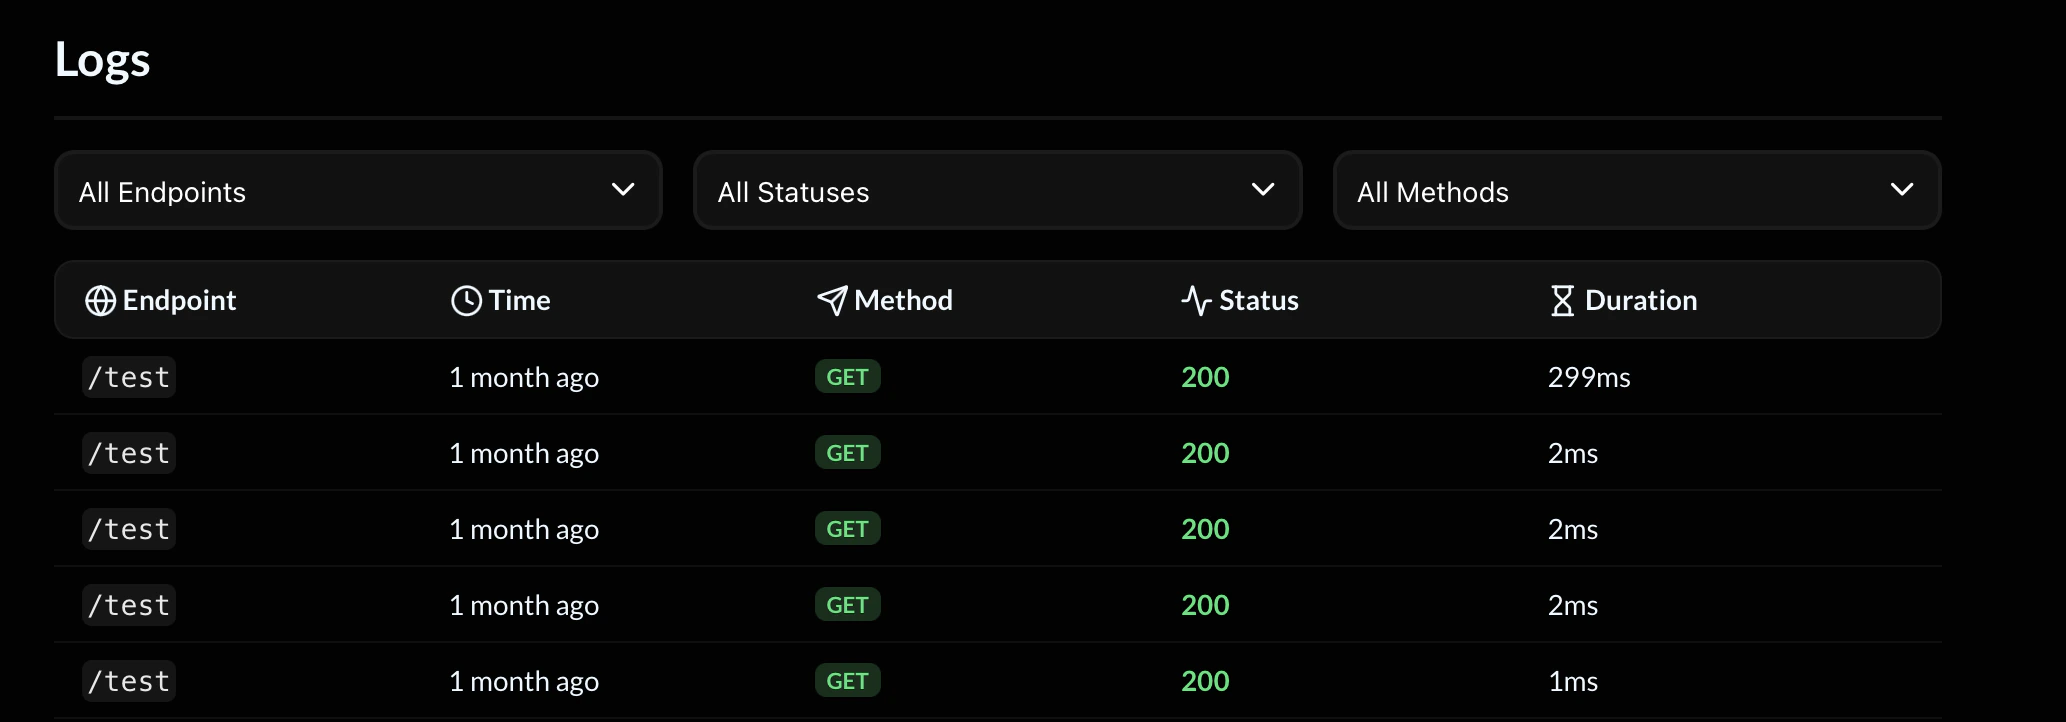
The **Logs** page provides a complete history of requests made to your API endpoints.
It allows you to monitor traffic, debug issues, and analyze performance in real time.
 ***
## Overview
Each log entry represents a single request made to one of your endpoints.
For every request, you can see:
* Endpoint path
* Timestamp
* HTTP method
* Response status
* Execution duration
This makes it easy to identify errors, slow endpoints, or unusual traffic patterns.
***
## Filters
At the top of the page, you can filter logs by:
### Endpoint
Filter by a specific endpoint path to isolate activity.
Example:
```
/test1
```
***
### Status
Filter by HTTP response status code.
Common status codes:
* `200` → Successful request
* `400` → Bad request
* `401` → Unauthorized
* `404` → Not found
* `500` → Internal server error
Filtering by status is especially useful when debugging failures.
***
### Method
Filter by HTTP method:
* `GET`
* `POST`
* `PUT`
* `PATCH`
* `DELETE`
This helps narrow down activity when an endpoint supports multiple request types.
***
## Log Fields
Each row in the logs table contains the following columns:
| Field | Description |
| -------- | ----------------------------------- |
| Endpoint | The path that was requested |
| Time | When the request was made |
| Method | The HTTP method used |
| Status | The HTTP response status code |
| Duration | Total execution time of the request |
***
## Duration
The **Duration** value shows how long the request took to complete.
* Measured in milliseconds (ms)
* Includes the full execution of your flow
* Helpful for performance monitoring
If durations are unexpectedly high, review:
* External API calls
* AI generation blocks
* Email sending
* Complex flow logic
***
## Pagination
If your API receives a high volume of traffic, logs are divided into pages.
Use **Back** and **Next** to navigate between pages.
***
## Debugging Workflow
When troubleshooting an issue:
1. Filter by the relevant endpoint
2. Filter by failing status codes (e.g., `400` or `500`)
3. Review duration for performance anomalies
4. Reproduce the request if needed
The **Logs** page is your primary tool for diagnosing issues and monitoring the health of your API.
***
## Overview
Each log entry represents a single request made to one of your endpoints.
For every request, you can see:
* Endpoint path
* Timestamp
* HTTP method
* Response status
* Execution duration
This makes it easy to identify errors, slow endpoints, or unusual traffic patterns.
***
## Filters
At the top of the page, you can filter logs by:
### Endpoint
Filter by a specific endpoint path to isolate activity.
Example:
```
/test1
```
***
### Status
Filter by HTTP response status code.
Common status codes:
* `200` → Successful request
* `400` → Bad request
* `401` → Unauthorized
* `404` → Not found
* `500` → Internal server error
Filtering by status is especially useful when debugging failures.
***
### Method
Filter by HTTP method:
* `GET`
* `POST`
* `PUT`
* `PATCH`
* `DELETE`
This helps narrow down activity when an endpoint supports multiple request types.
***
## Log Fields
Each row in the logs table contains the following columns:
| Field | Description |
| -------- | ----------------------------------- |
| Endpoint | The path that was requested |
| Time | When the request was made |
| Method | The HTTP method used |
| Status | The HTTP response status code |
| Duration | Total execution time of the request |
***
## Duration
The **Duration** value shows how long the request took to complete.
* Measured in milliseconds (ms)
* Includes the full execution of your flow
* Helpful for performance monitoring
If durations are unexpectedly high, review:
* External API calls
* AI generation blocks
* Email sending
* Complex flow logic
***
## Pagination
If your API receives a high volume of traffic, logs are divided into pages.
Use **Back** and **Next** to navigate between pages.
***
## Debugging Workflow
When troubleshooting an issue:
1. Filter by the relevant endpoint
2. Filter by failing status codes (e.g., `400` or `500`)
3. Review duration for performance anomalies
4. Reproduce the request if needed
The **Logs** page is your primary tool for diagnosing issues and monitoring the health of your API.